Implementing Open Science
IOSP, Leiden, 2026
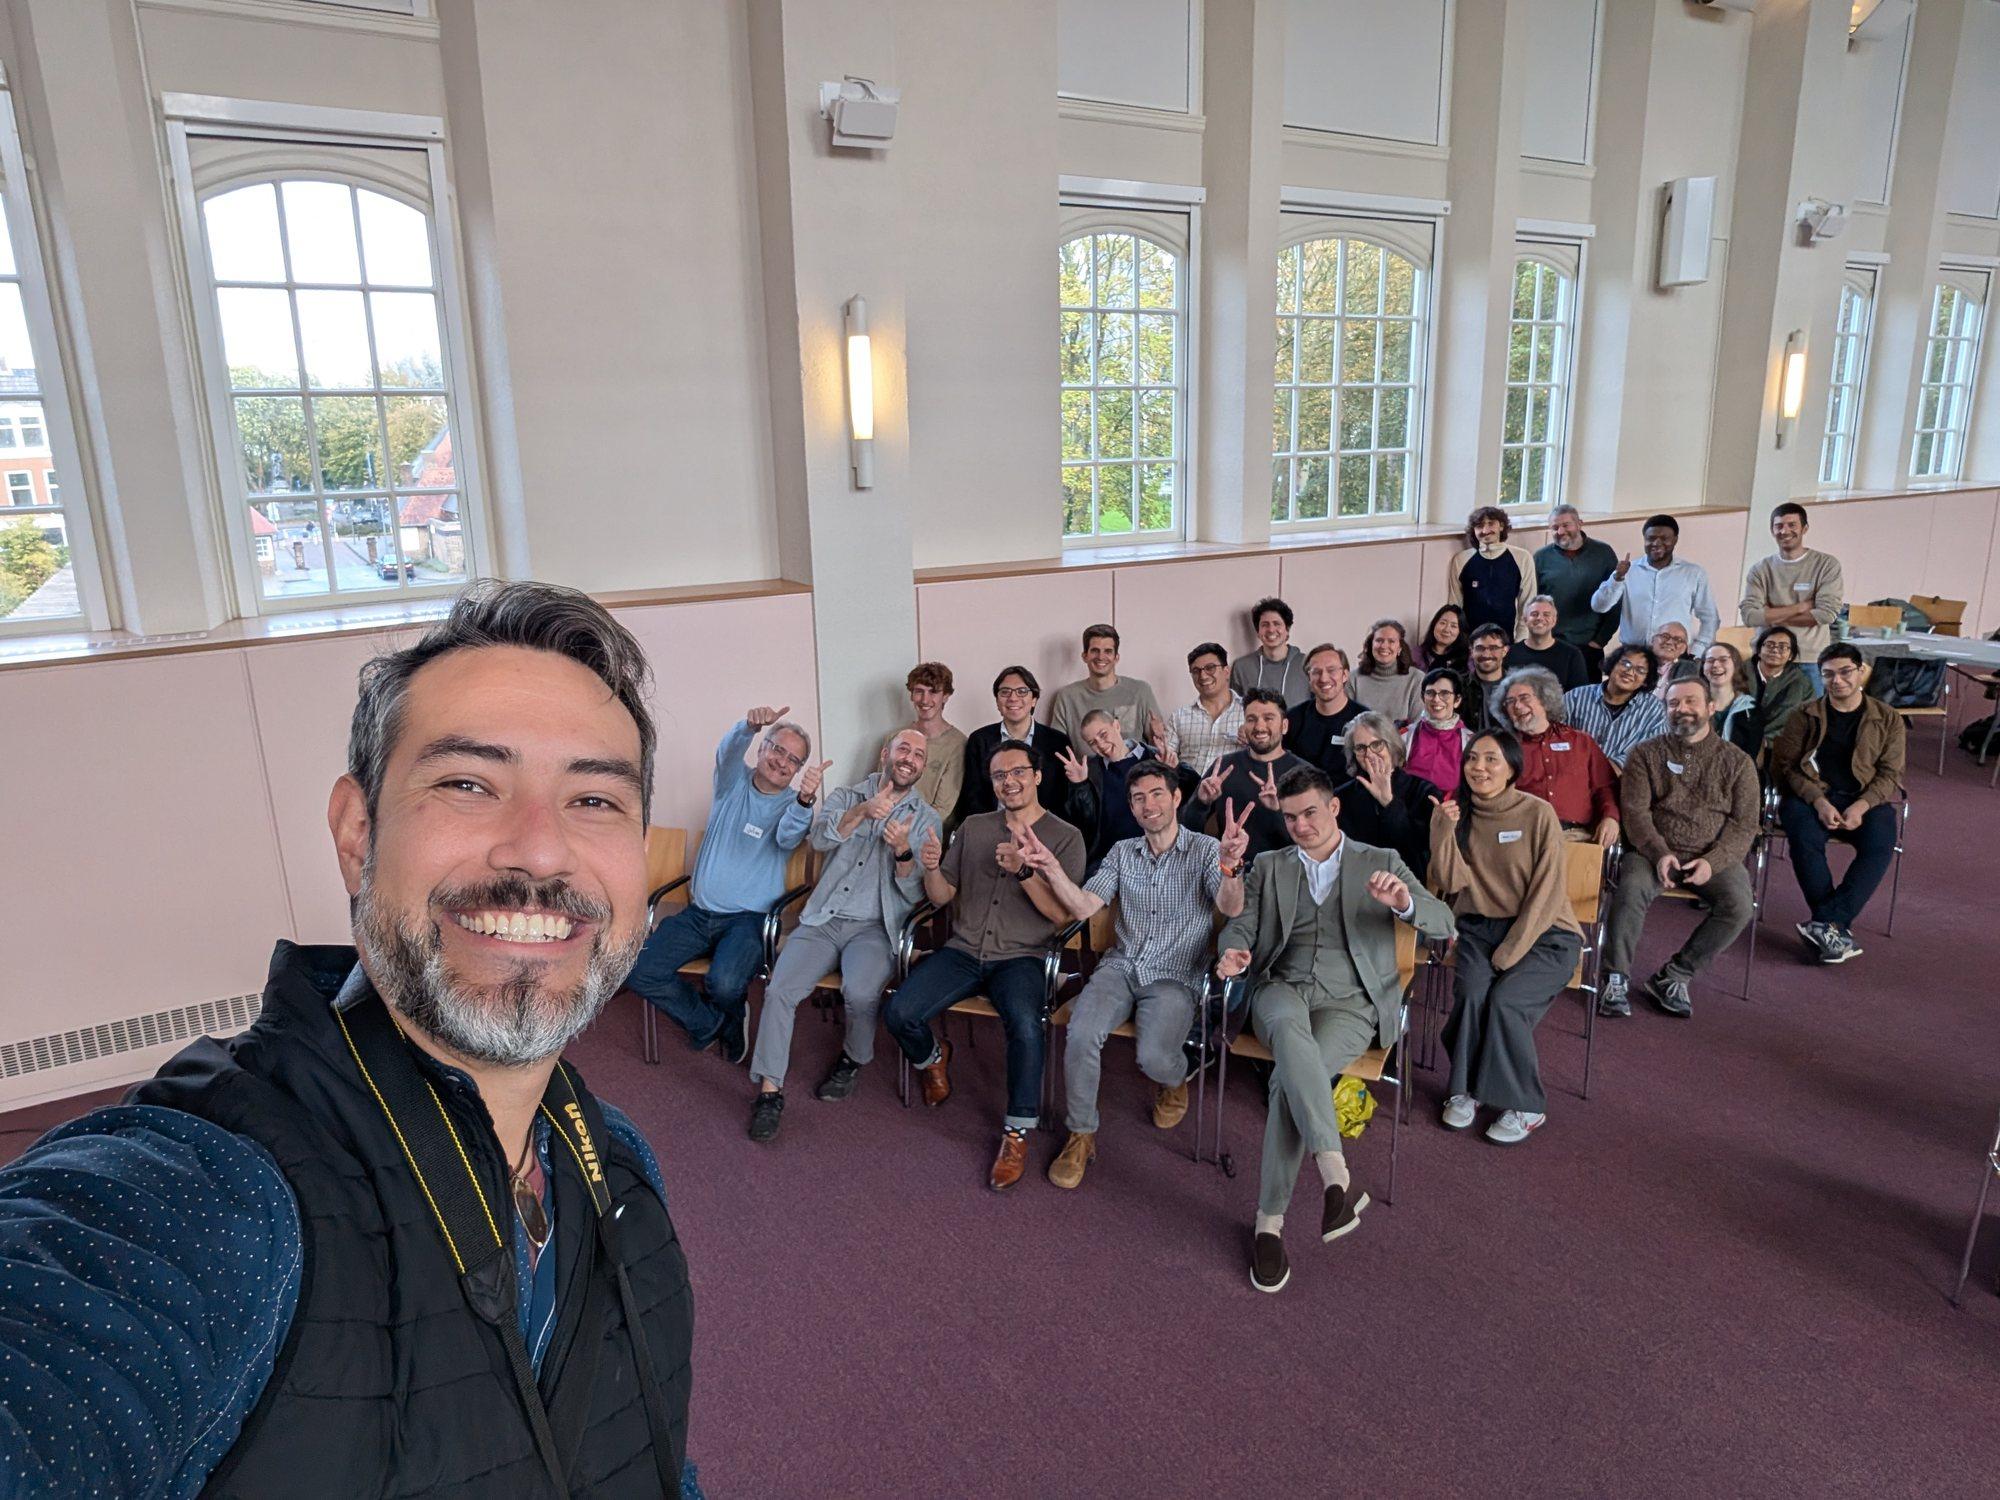
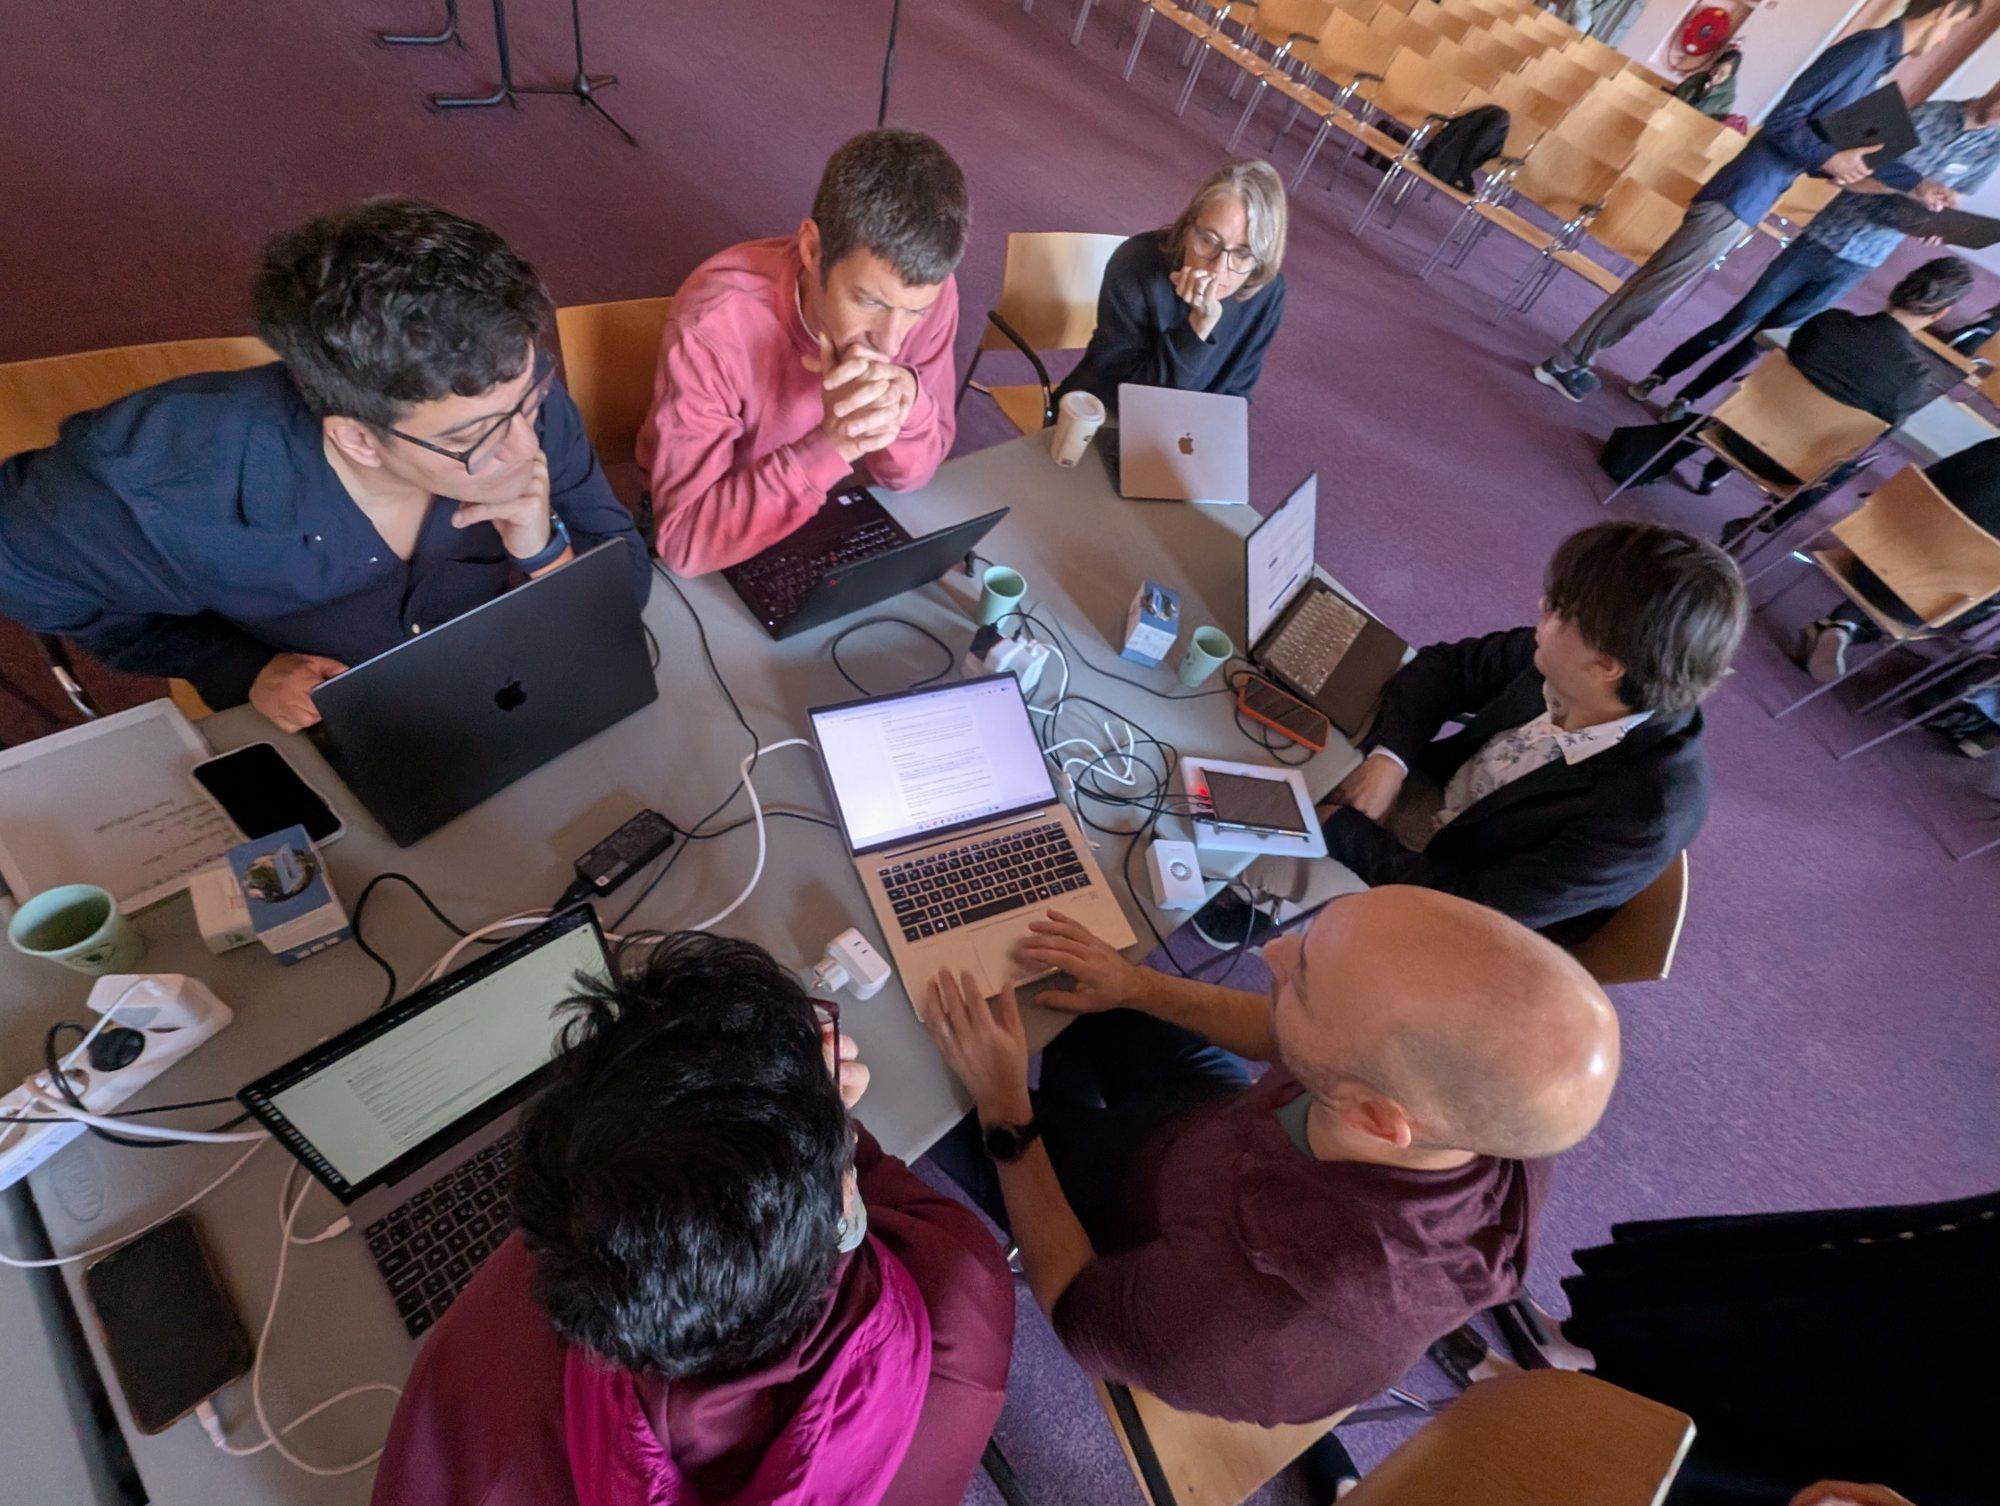
For four days in October, about 45 researchers, librarians, engineers, publishers, and tool builders filled the Poortgebouw in Leiden for the Institute of Open Science Practices (IOSP), hosted with the GO FAIR Foundation and run by SciOS.
OrganizersJonathan Starr, Ellie DeSota
Workshop leadsJonathan Starr, Cornelius Ihle, Ronen Tamari, Torsten Goerke, Ariel Lighty, Robin Berjon, Guido Jansen, Matthew Akamatsu, Tobias Kuhn, Tim Fellows, Ellie DeSota, Anne Fouilloux, Jen van der Meer
PanelistsJulien Masanès, Matthew Akamatsu, Clifford Tatum, Jen van der Meer, Sarah Lippincott, Michael Markie, Anne Fouilloux, Michelle Lee
Showcase presentersCornelius Ihle, Tim Fellows, Srobona Ghosh, Harrison Dekker, Meem Arafat Manab, Jonathan Starr, Leo Torres, Patrick Prochazka, Rodrigo Migueles Ramirez, Ricardo Hartley Belmar, Mathïs Fédérico
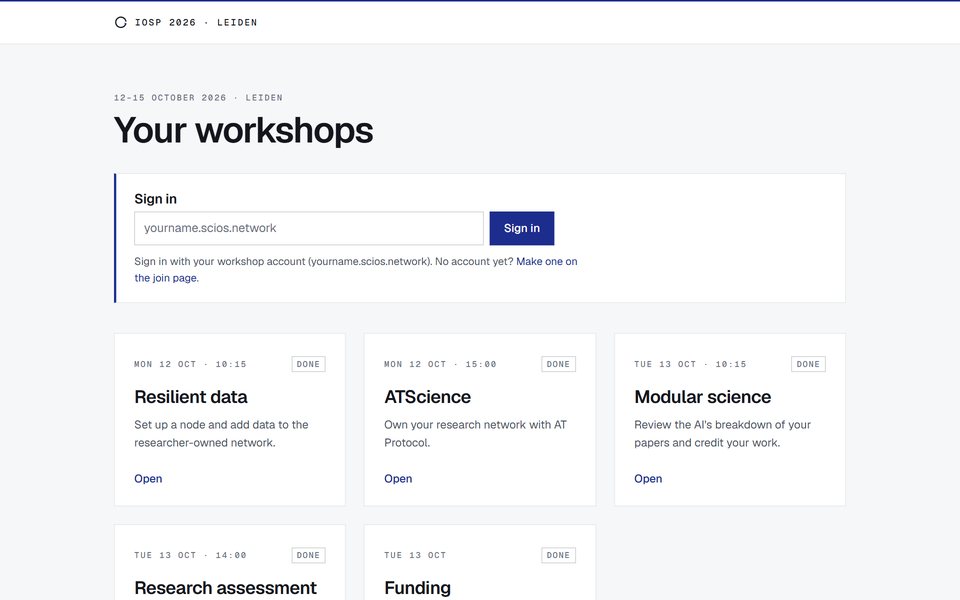
For the first two days, we built a working stack for open science, the tools to Store, Share, Assess, and Fund research today, and tried it on our own work.
On both afternoons, open science tooling projects showcased their work advancing the frontier of possibilities.
On the third day, participants planned the program themselves and ran nine sessions across Leiden.
We began a community theory of change for science on the last morning.
Day 1, Identities
Most online services give each person a separate account.
On the AT Protocol, a person uses one identifier in every service built on the protocol.
This means all your digital contributions to the scientific record are granularly attributed to you.
Also, everything published through an app on ATProto, from a dataset to a single claim, gets its own free persistent identifier (PID) the moment it is published.
These PIDs are natively versionable and verifiable. Anyone and any machine can discover, cite, and verify the exact version used, and more.
So SciOS built bespoke apps on ATProto for the entire workshop.
 Check-in
 Dashboard
 Data network
 Modular science
 Event graph
 Assessment
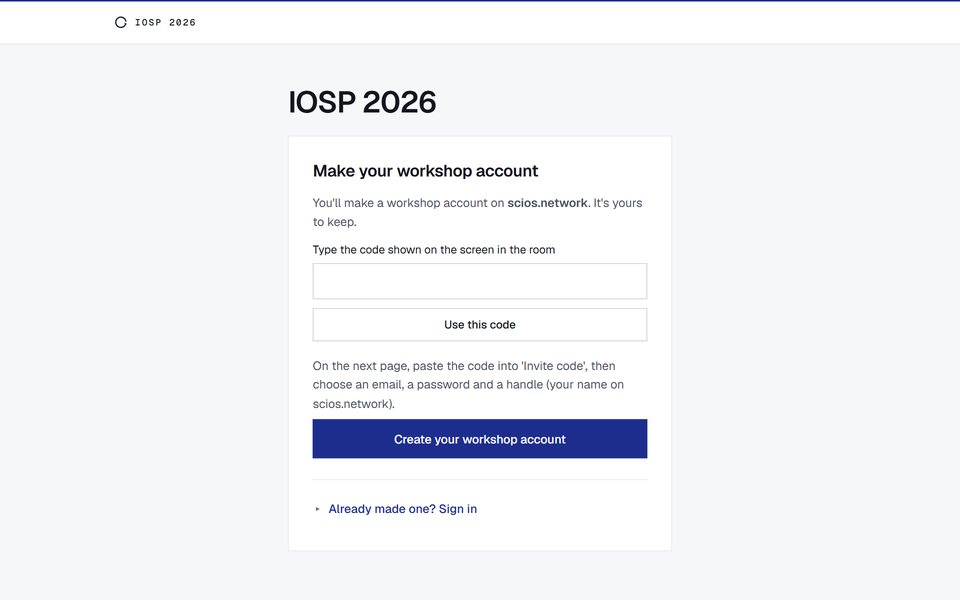
At check-in, 44 of us each created a decentralised identifier (DID) on the AT Protocol.
We'll check in on the activities of these two DIDs periodically.
- A
did:plc:uhjpwcrqmxtnsk4alufts6gi - B
did:plc:ubnjbsk3m7busncbqjzlsgsr
For the rest of the week, each of our contributions went into a shared record, attributed to our own identifiers.
Day 1 morning, Store
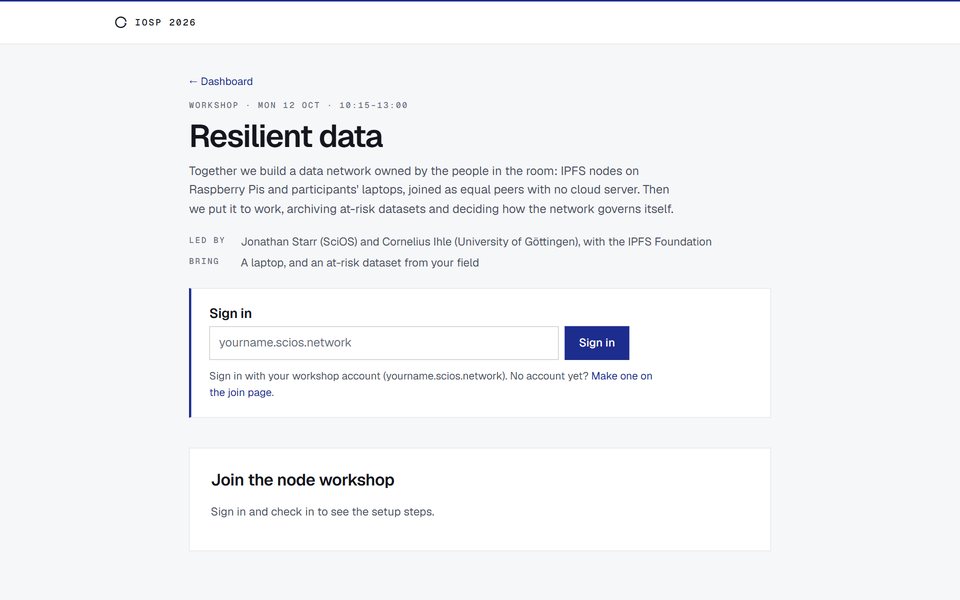
The data network workshop
Led by Jonathan Starr (SciOS) and Cornelius Ihle (University of Göttingen) in partnership with the IPFS Foundation
Many labs keep a single copy of their research data on one computer or with one hosting service.
That data can be lost when a grant ends or a hosting service closes.
11 of our laptops7 Raspberry Pis
So we built our own data network that keeps many copies on 11 of our laptops and 7 Raspberry Pis.
Adid:plc:uhjpwcrqmxtnsk4alufts6gi
- signed record
- a claim on a node of the data network
- node
- laptop-steel-thunder
- claimed
- 11:27 on Day 1
- on the network
- one of the 11 laptops at its peak, and served a dataset when asked on Day 2
Like email and BitTorrent, it runs on an open protocol. Each machine that joins adds another copy, so the data stays when any one organisation or node shuts down.
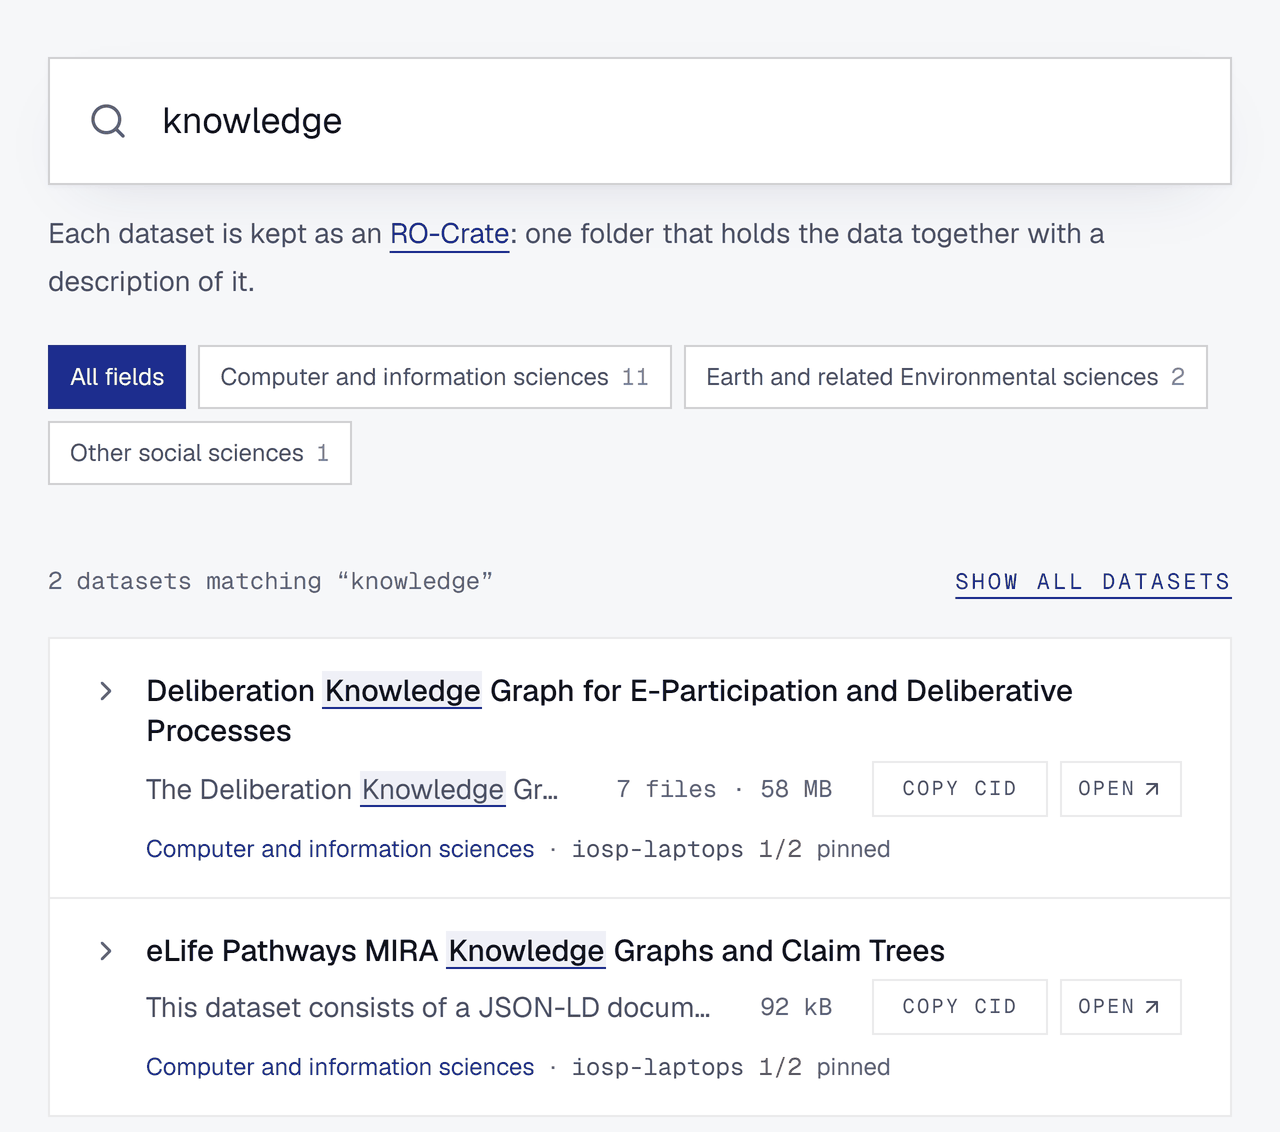
Every dataset added to the network is analysed by a special type of node, which turns it into an RO-Crate, gives it keywords, indexes it, and makes it findable and usable by humans and machines.
Scientific claims dataset
- Analysed
- 7,252 files · 293 MB · CC-BY-4.0
- RO-Crate
- the data packaged with machine-readable metadata
- Keywords
- scholarly document processing
- scientific claim verification
- evidence retrieval
- natural language processing
By lunch, the network held seven datasets.
Four weeks after the workshop, every dataset was still held in full, each with a copy on a machine that a participant took home.
See it for yourself
Day 1 afternoon, ATScience
The ATScience workshop
Led by Ronen Tamari, Torsten Goerke, Ariel Lighty, Robin Berjon, and Guido Jansen
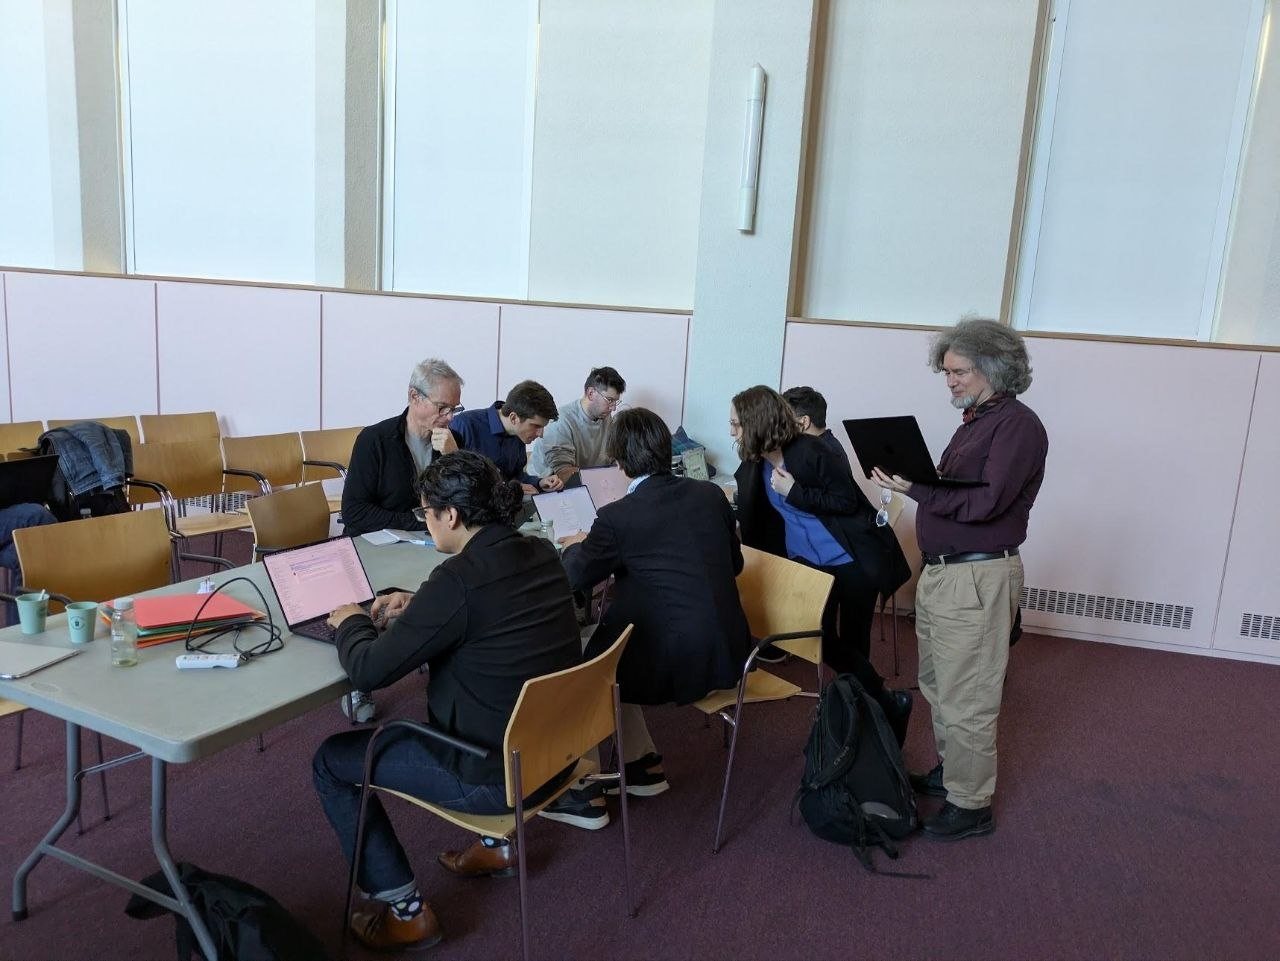
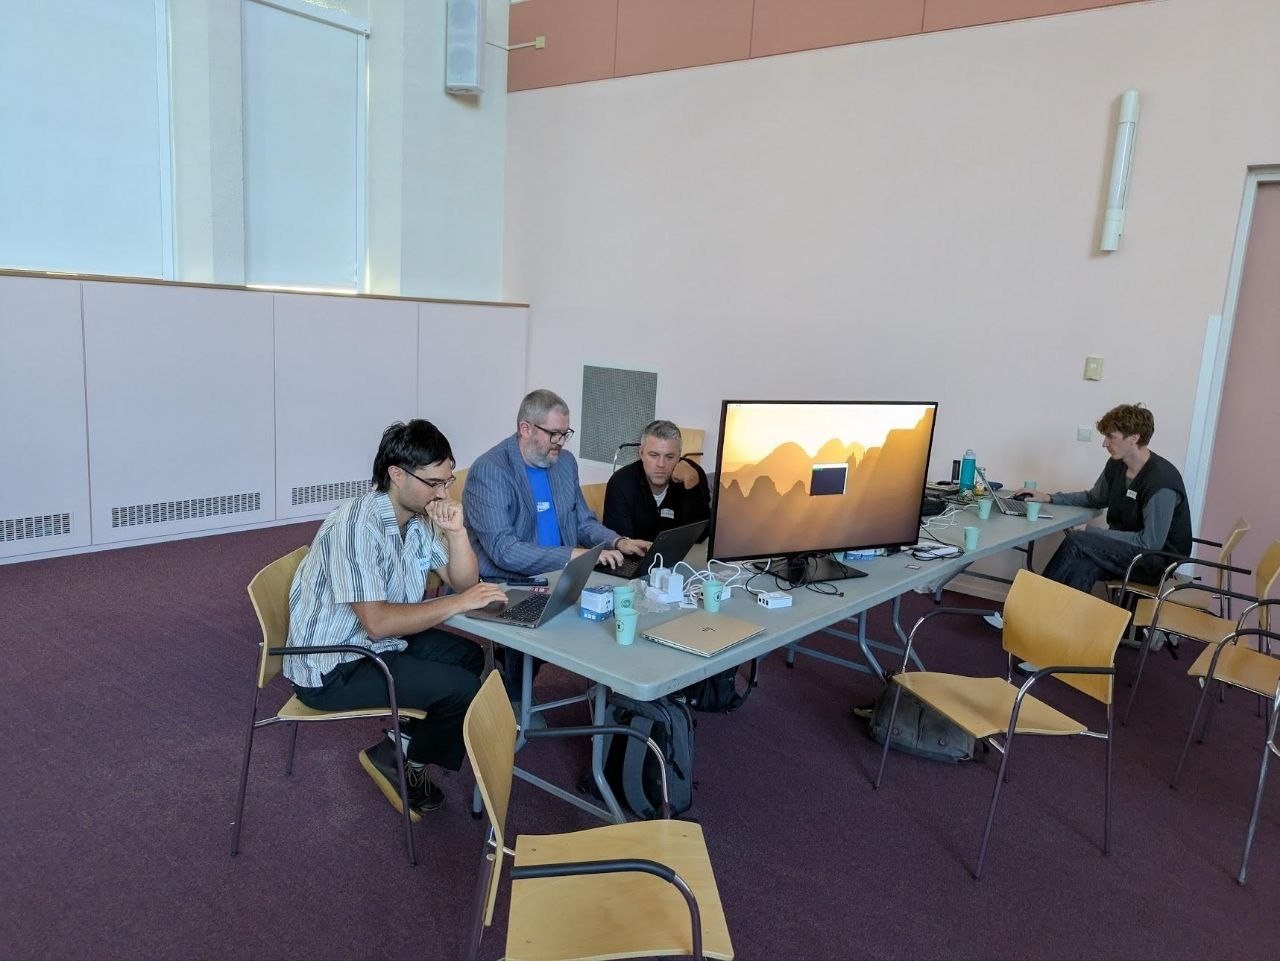
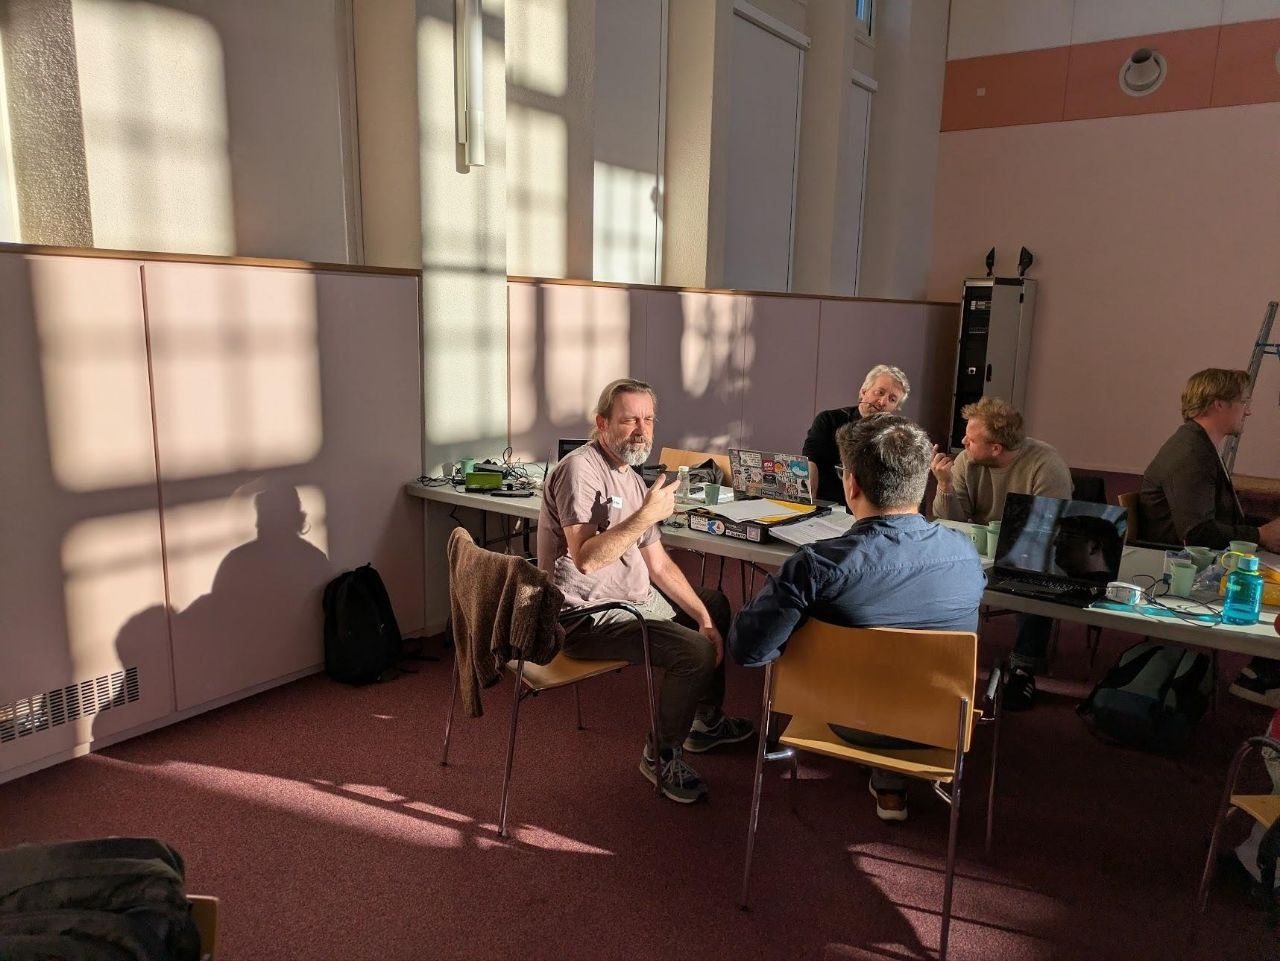
At six stations, the workshop’s leads showed what researchers can already do with tools built on AT Proto.
Aster launched Aster ID, which Aster describes as a verified identity for researchers.
Participants at the workshop were the first researchers to open accounts with Aster.
Day 2 morning, Share
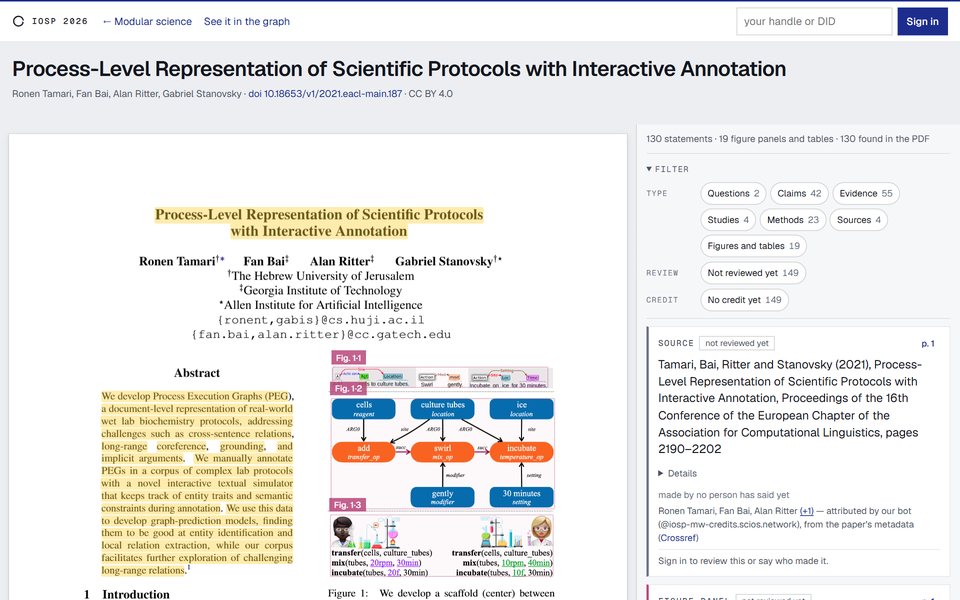
The modular science workshop
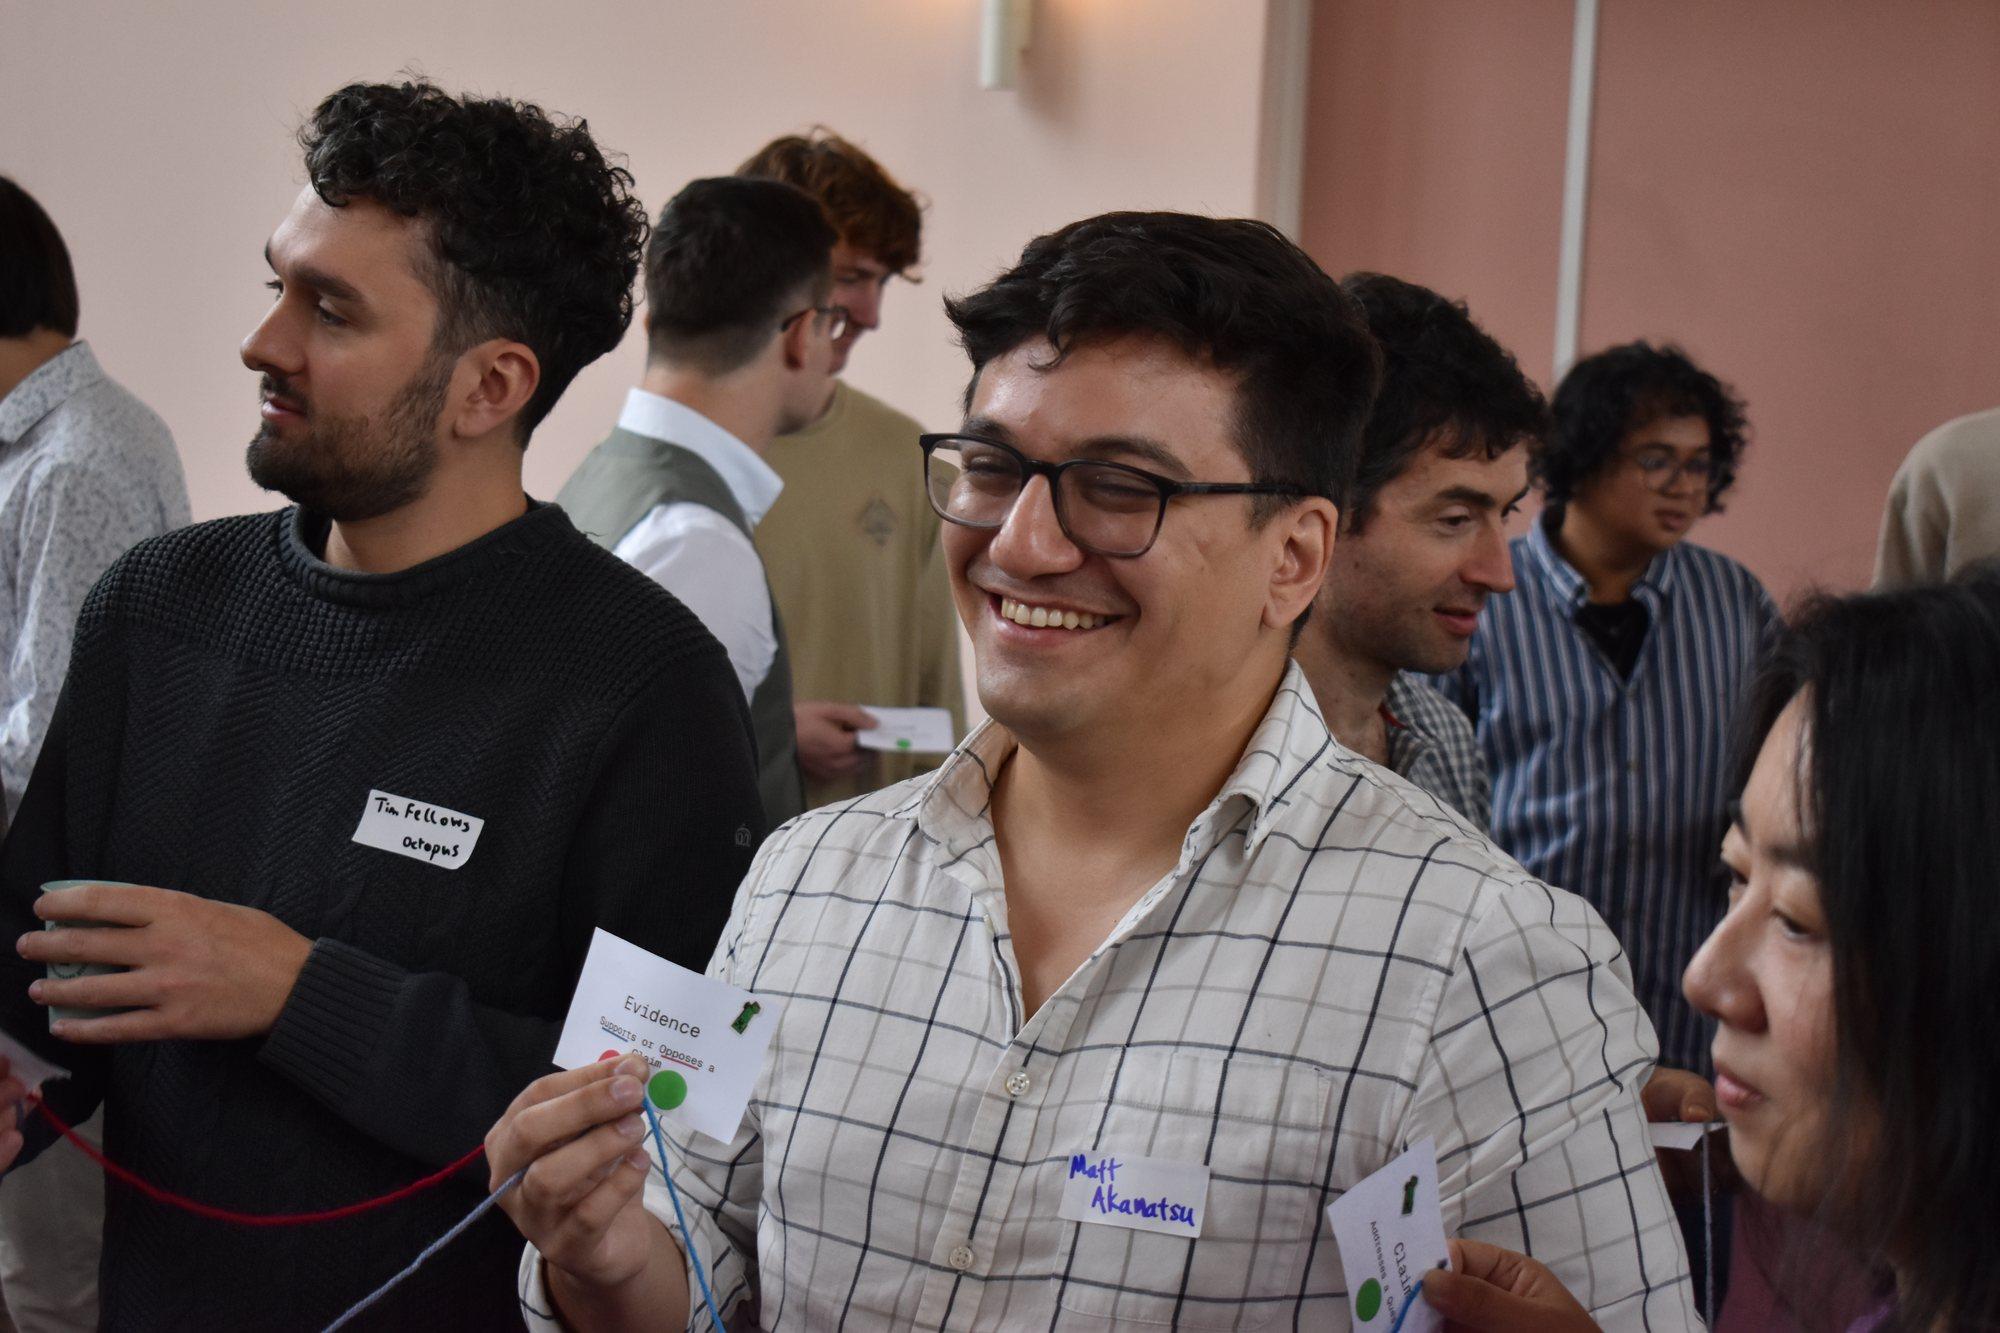
Led by Matthew Akamatsu (University of Washington), Tobias Kuhn (Vrije Universiteit Amsterdam), Tim Fellows (Octopus), and Jonathan Starr and Ellie DeSota (SciOS)
Research is published as whole papers, so the claims, evidence, and methods inside them are hard to find, check, or credit on their own.
SciOS’s extraction pipeline breaks a paper into its granular contributions, including its questions, claims, evidence, and methods, each published as a unique contribution in the shared record.
SciOS’s attribution agent then attributes every derived contribution to every author of the original paper, with each attribution record marked as generated by the agent itself.
Before the event, SciOS ran 159 of participants’ papers through the pipeline and agent, deriving 45,907 contribution records and over 116,000 attribution records.
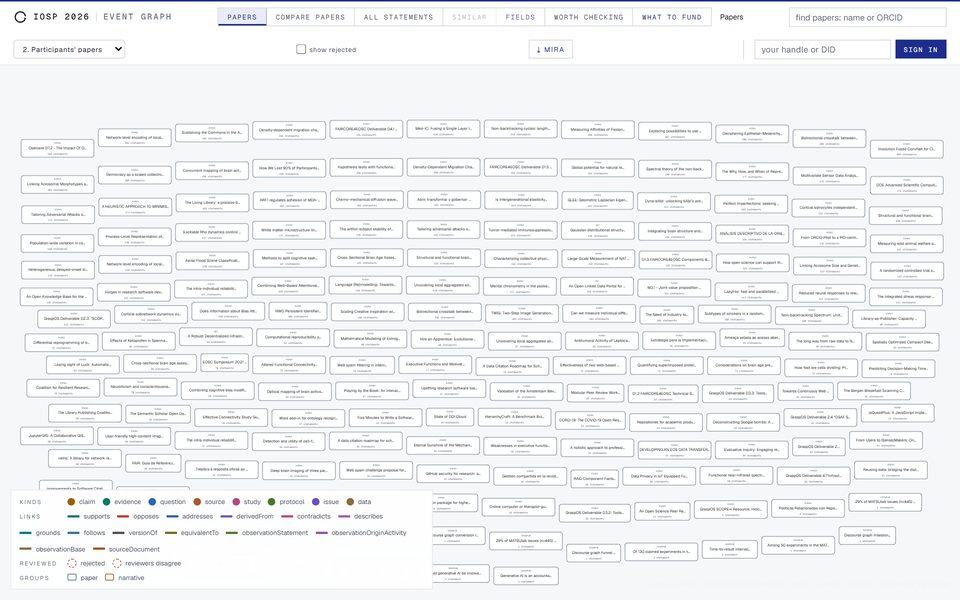
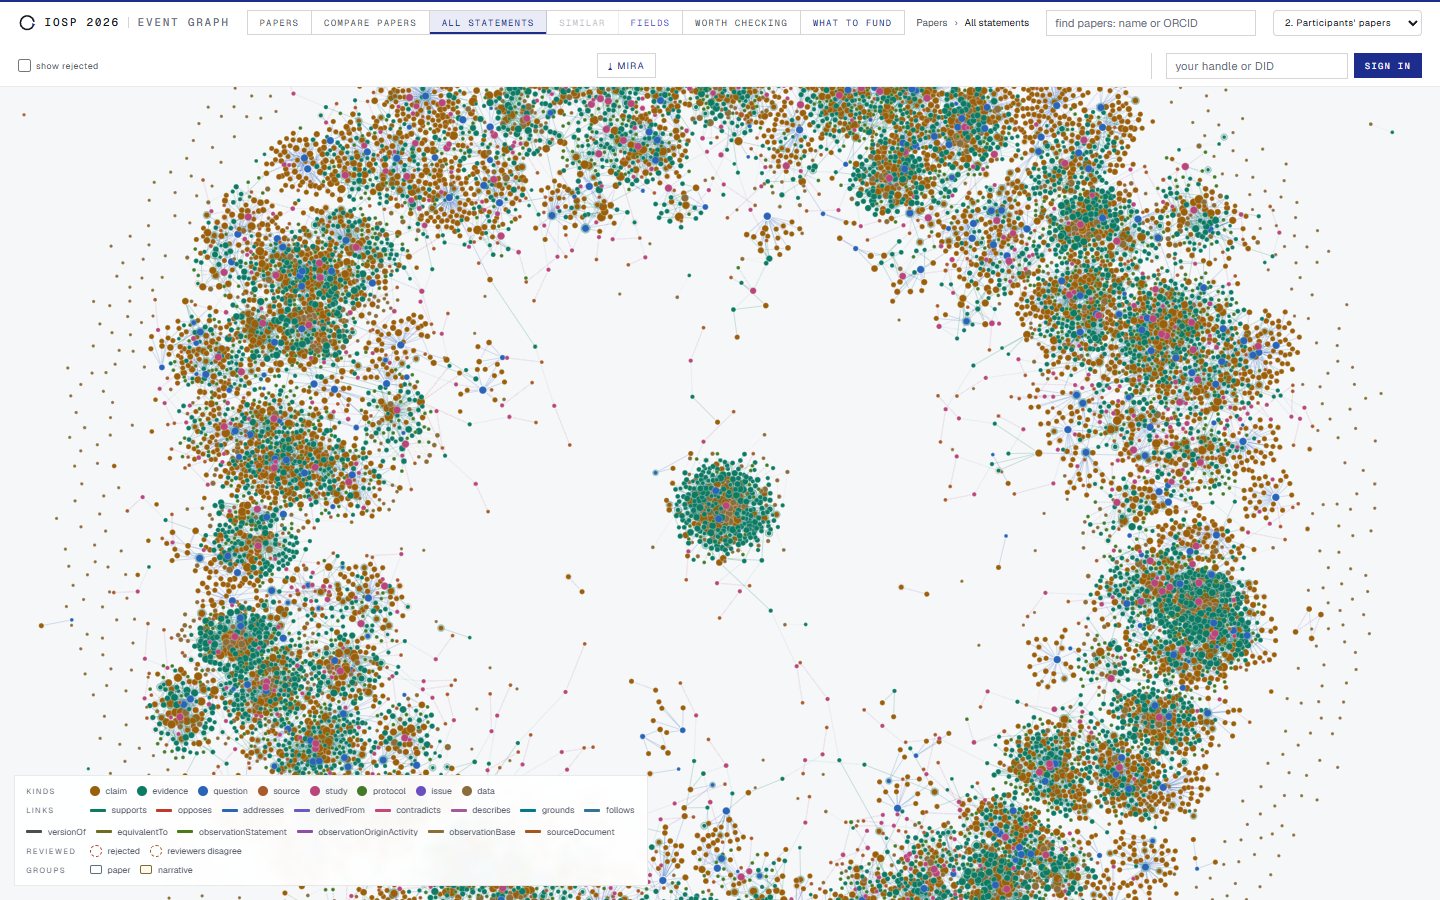
The result was a shared record of 17,681 attributed contributions to science joined by 30,187 links.
During the workshop, participants used three tools to publish 4,161 contributions to the shared record directly. All three tools write records in one shared schema, MIRA, so their users all contribute to the same scientific record.
22 participants linked their ORCID to their new identifier, so the graph could match them to the contributions derived from their papers.
22 of the 44
Adid:plc:uhjpwcrqmxtnsk4alufts6gi
- signed record
- a link to an ORCID iD
- linked
- 11:21 on Day 2
- found
- A's paper, with 88 contribution records the attribution agent had already credited to A
Bdid:plc:ubnjbsk3m7busncbqjzlsgsr
- signed record
- a link to an ORCID iD
- linked
- 11:14 on Day 2
- found
- B's paper, uploaded and derived at the workshop on Day 1
Ten participants reviewed 78 of the contributions the AI had derived from their papers.
They confirmed 72 as accurate, rewrote 5 in their own words, and rejected 1. They also made sure to attribute specific work within their papers to themselves or to colleagues.
10 of the 44
Adid:plc:uhjpwcrqmxtnsk4alufts6gi
- signed records
- 31 reviews, all accepted
- reviewed
- 15 claims, 9 pieces of evidence, 4 protocols, 2 questions, and 1 study
- when
- 11:24 to 11:48 on Day 2
- credited
- 29 contribution records to A, and 5 to colleagues
Bdid:plc:ubnjbsk3m7busncbqjzlsgsr
- signed records
- 8 reviews, all accepted
- reviewed
- 8 claims
- when
- 11:29 to 11:34 on Day 2
- credited
- 8 contribution records to B, and 3 to colleagues
The result was a graph of 72 contribution records that participants validated and attributed to the appropriate author.
See it for yourself
Day 2 afternoon, Assess and Fund
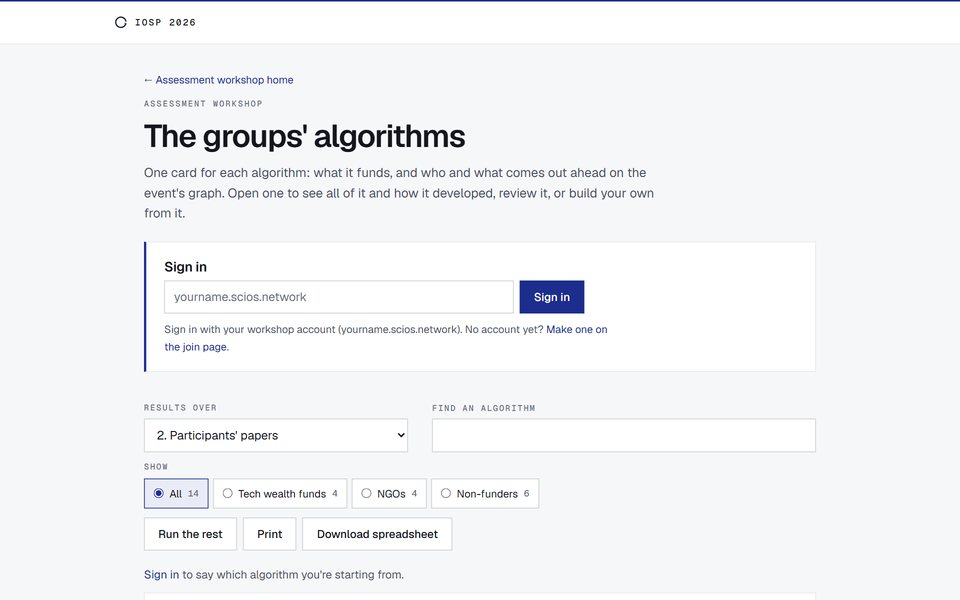
The assessment workshop
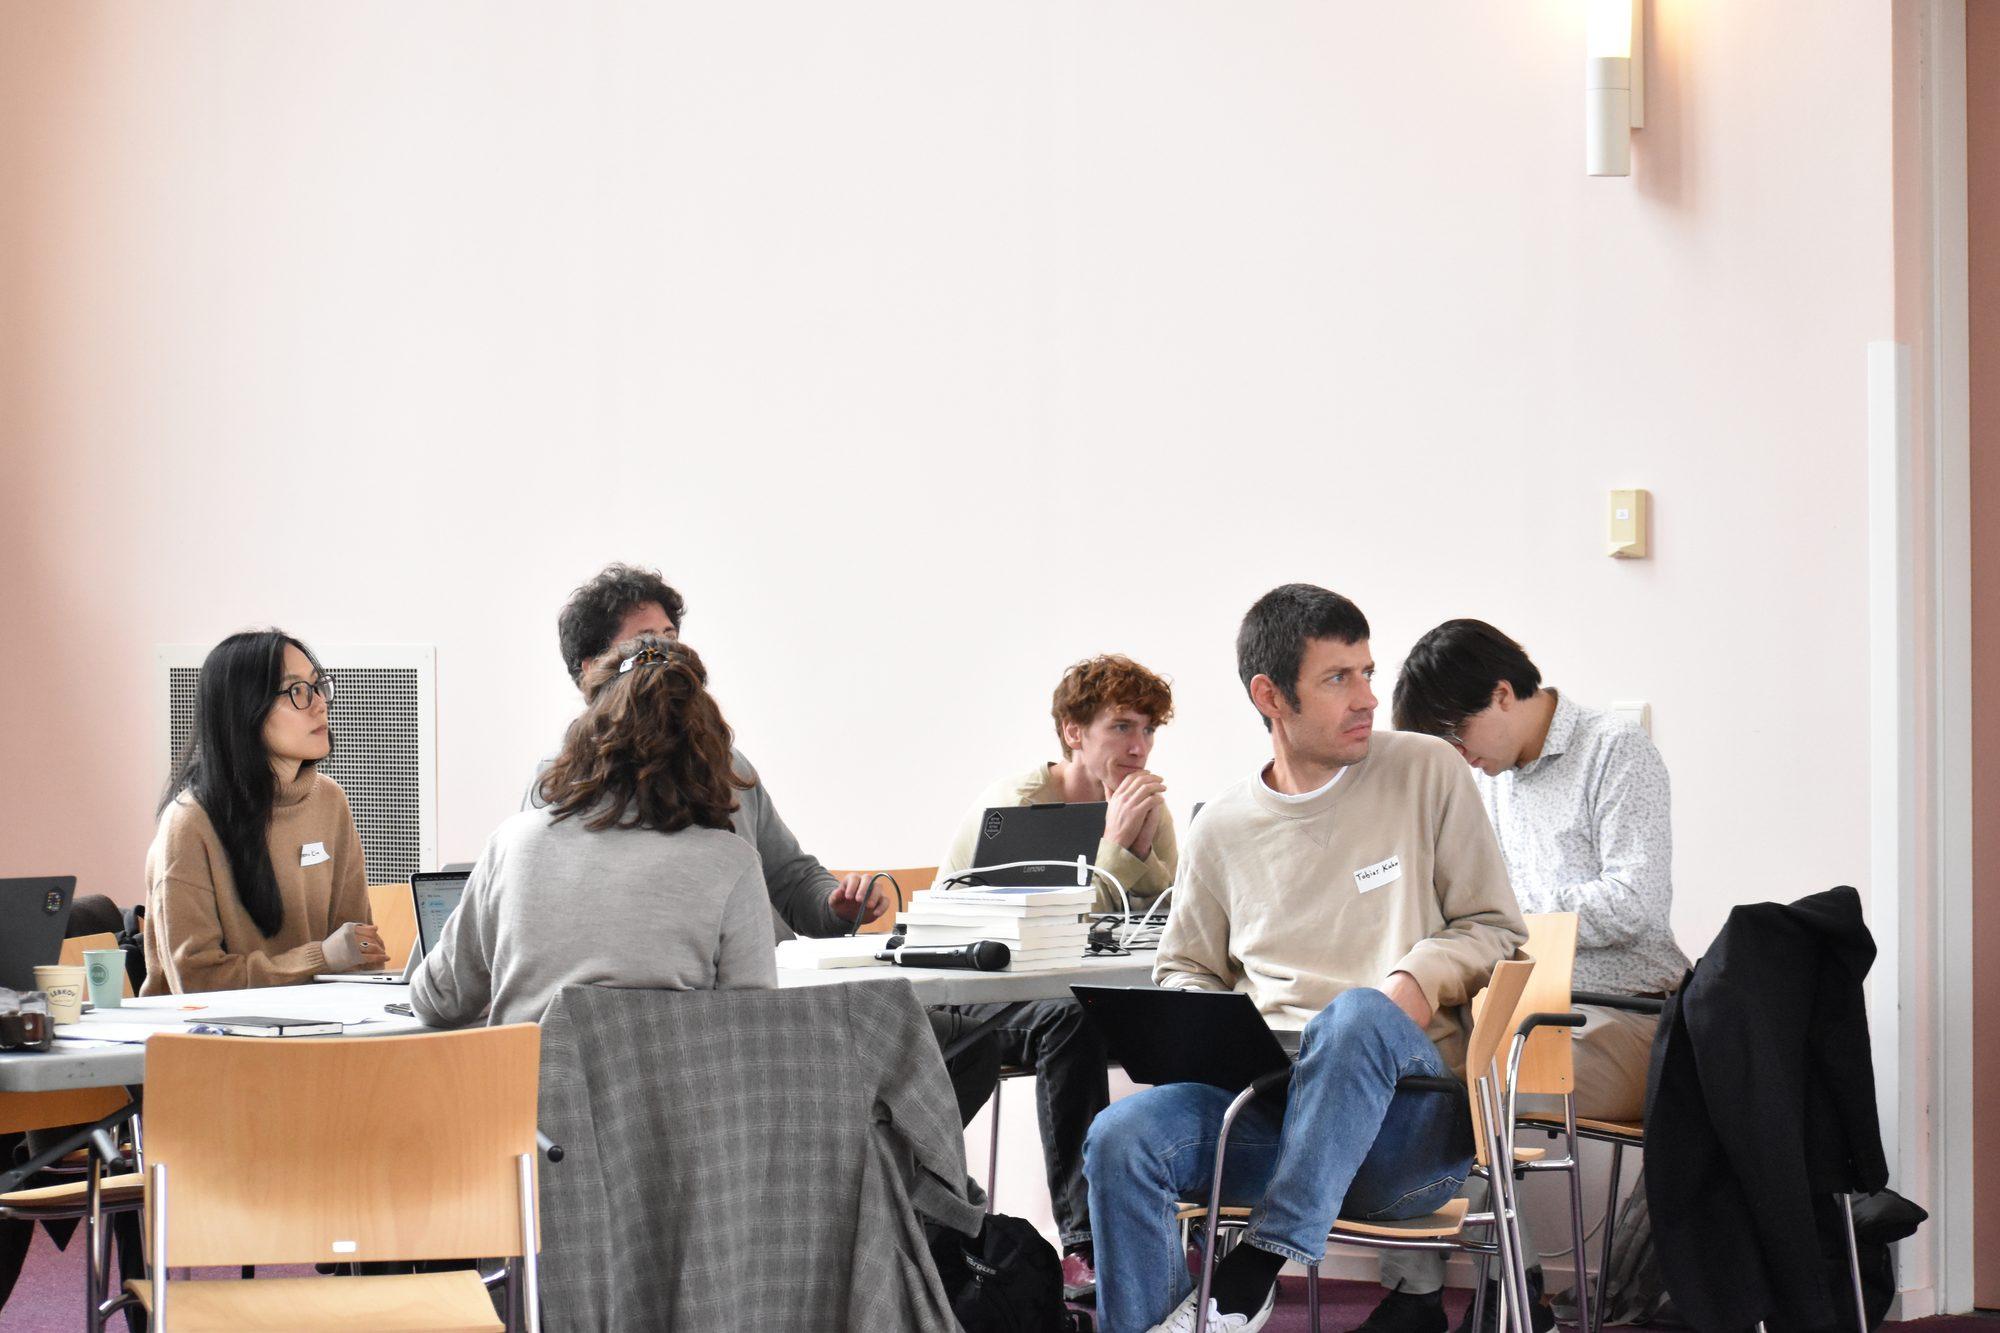
Led by Anne Fouilloux (Science Live) and Jonathan Starr and Ellie DeSota (SciOS)
The funding workshop
Led by Jen van der Meer (Parsons School of Design)
Funders often have nothing to judge research by but citations and journal rankings, which say little about what each funder values.
An assessment algorithm uses that data to score each contribution against a funder’s own goals.
a funder's algorithm
- goal
- find new treatments for antibiotic-resistant infections sooner
- ranks questions by
- how few claims have answered them yet
- ranks protocols by
- how many studies in the field follow them
- ranks researchers by
- how many of their claims others have verified
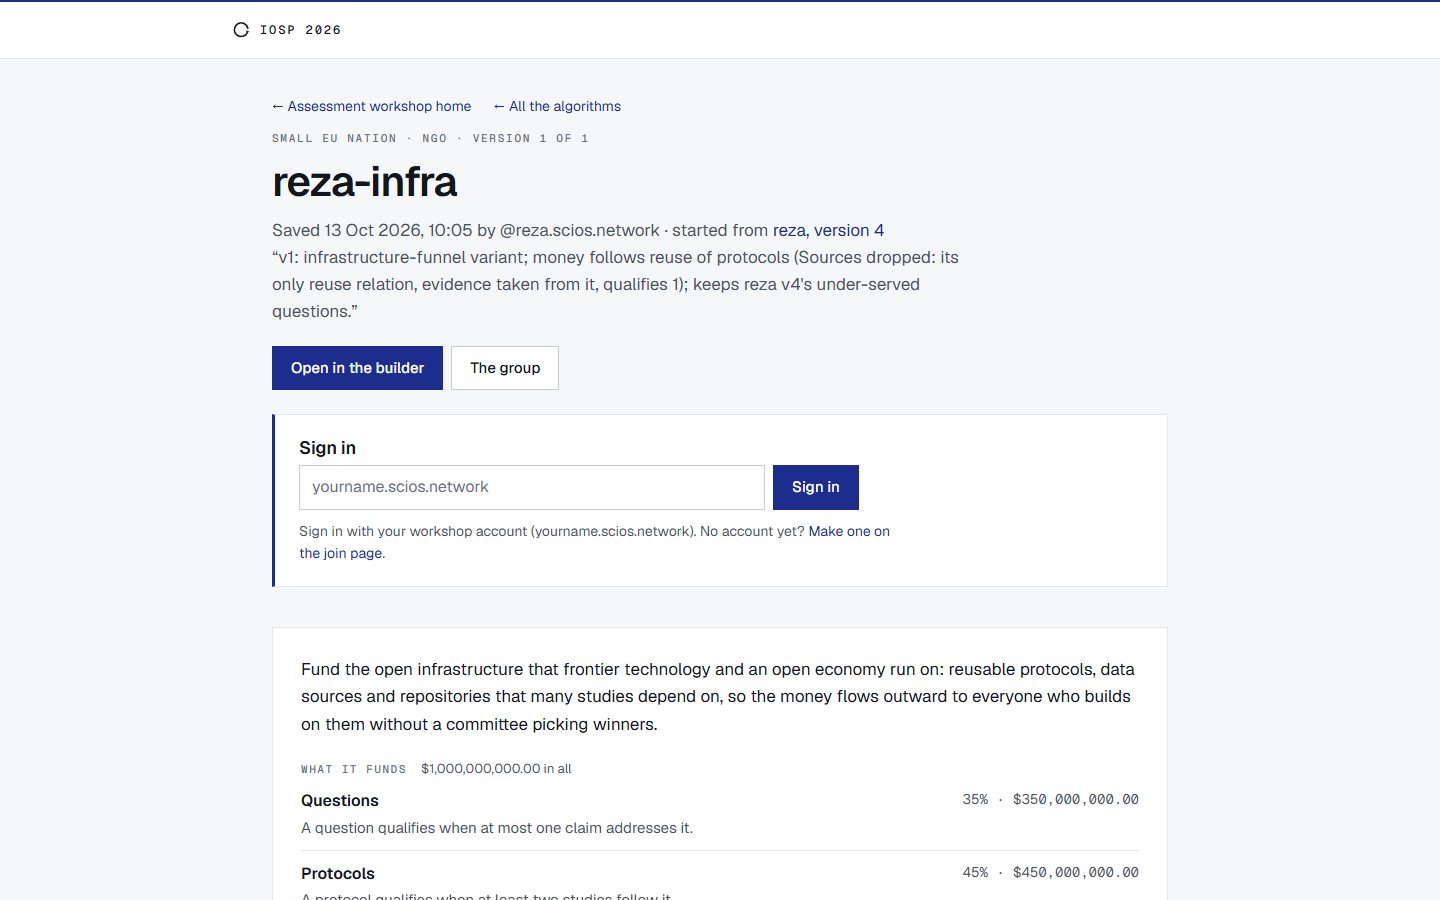
We had four groups take on roles of funders, such as a foundation built on tech wealth and the research council of a small European country.
Only 15 of the 44 signed in to the app, but all 44 participated.
In the app, each group told its algorithm what to reward, such as questions that few claims have answered, and how to split the money. Each change showed the new ranking of the whole graph in under a second.
That afternoon, the groups tried 397 rankings, asked an AI helper for suggestions 17 times, and saved 19 versions of eight algorithms.
A group could start a new algorithm, continue from a saved algorithm, or fork and build on another published algorithm.
This means one funder’s algorithm can become the starting point for another’s.
Bdid:plc:ubnjbsk3m7busncbqjzlsgsr
- signed records
- 6 versions of two algorithms
- group
- Everybodies
- looked for
- claims that are both supported and disputed
- when
- 16:04 to 16:38 on Day 2
One group, playing the small country's funder, published its assessment for research infrastructure, which picked out 17 research questions, 23 protocols, and 45 researchers from the whole graph.
Small EU nation, published result
- goal
- “Fund the open infrastructure that frontier technology and an open economy run on …”
- questions, 35%
- when at most one claim addresses it
- protocols, 45%
- when at least two studies follow it
- researchers, 20%
- when they made a protocol that at least two studies follow
- one of the 17
- B’s question, “Should generative AI be involved in decisions?”, published from Nano Dash at 12:02 on Day 2
A citation count gives one number for a whole paper. A graph of contribution records gives each claim, protocol, and piece of evidence its own links, authors, endorsements, and more.
In the funding workshop that followed, rooms of participants used the algorithms’ rankings as advice to decide together where the money should go.
Each room had role cards, access to all the algorithms, and ten plastic tulips that stood for the money.
Halfway through, each room opened an envelope that injected an unforeseen variable into its deliberations.
In every room, people used the algorithm's output only as a starting point for their own deliberation about where the money should go.
In one of the tech foundation's rooms, the envelope's demand for results within 18 months had more effect on the portfolio than the algorithm or the foundation's mandate.
While they decided what to fund, participants highlighted data that the shared record doesn’t currently contain.
Most of it was about people, such as a researcher’s career stage, location, current funding and when it ends, and time for new work.
In one afternoon, participants turned funders’ goals into algorithms that rank scientific contributions published in a shared record, then used those rankings as advice to decide how to distribute funds.
See it for yourself
Day 3, Community day
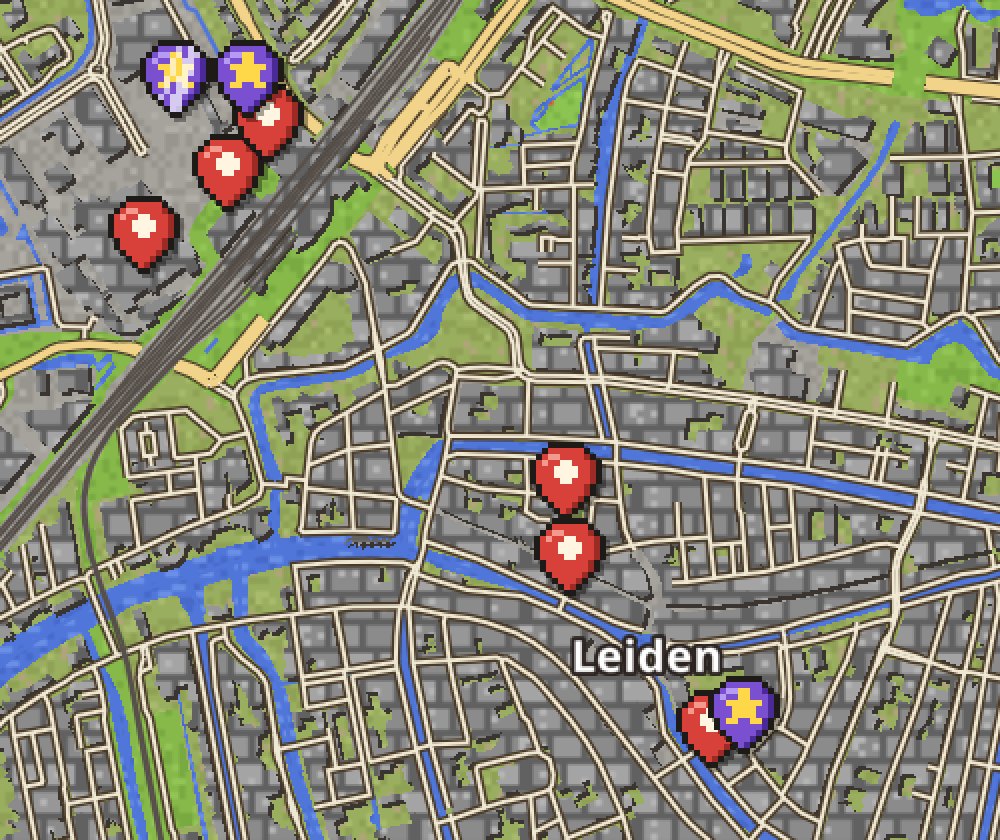
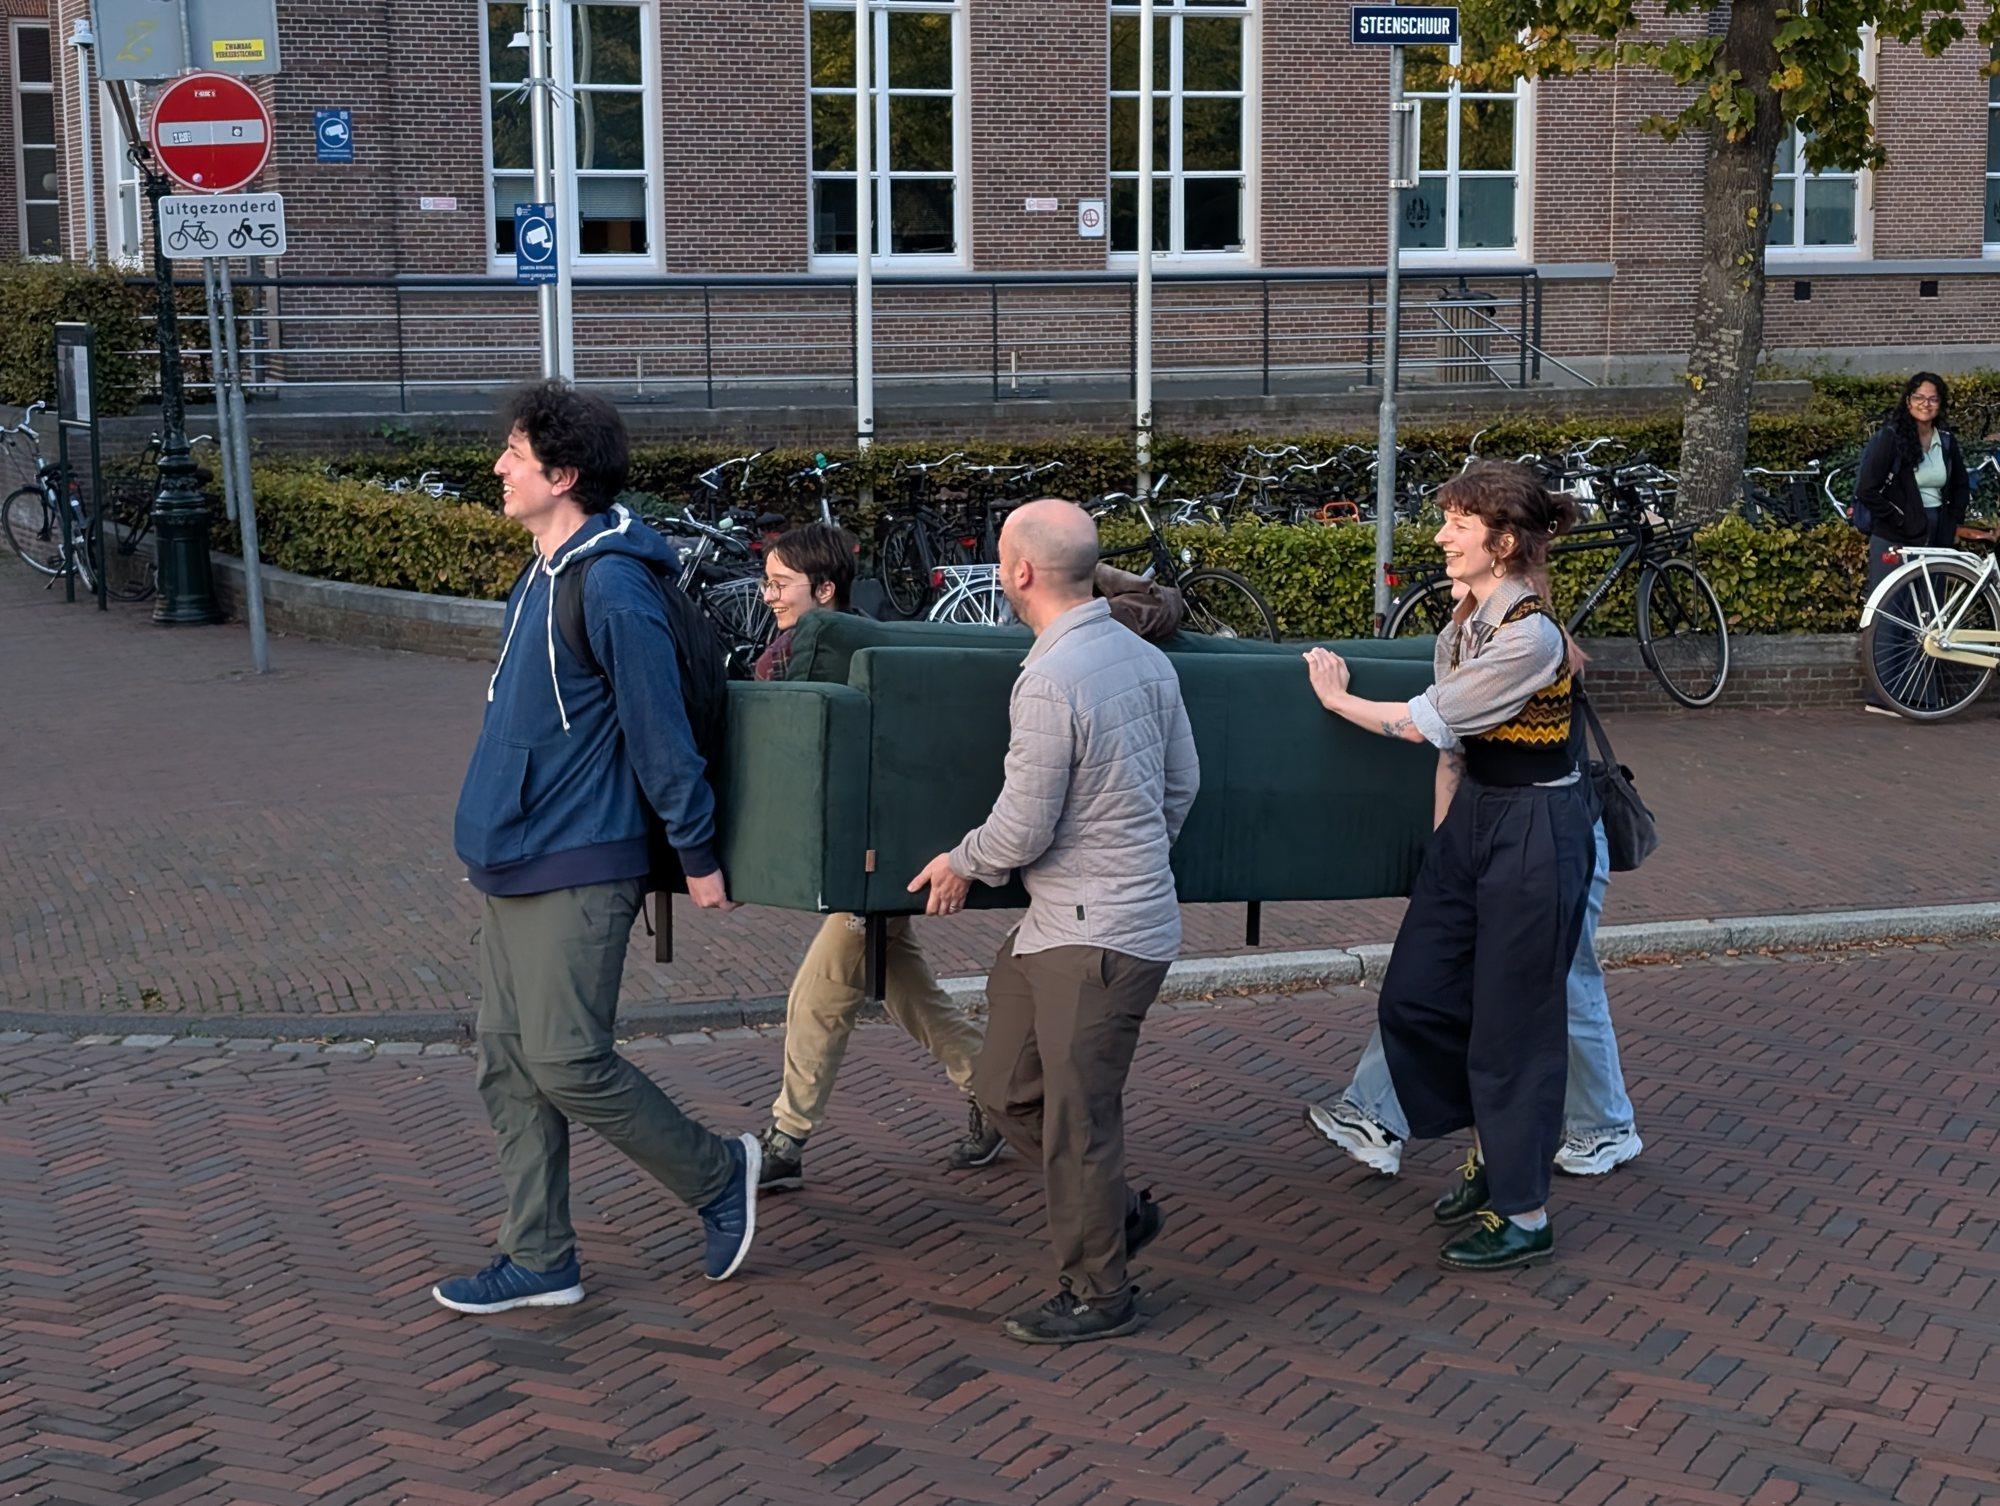
On community day, participants planned the program themselves and ran nine sessions across Leiden, despite a bus strike.
A convergence on modular science, hosted by eLife Pathways
A conversation on the MIRA schema over lunch
A discussion at a café on metadata schemas for the social sciences
A game about personal incentives and collective decisions
A visit to the exhibit on truth and doubt at the Rijksmuseum Boerhaave
A walking tour
A session on the paper of the future
A card game in a park
A dinner together in Leiden
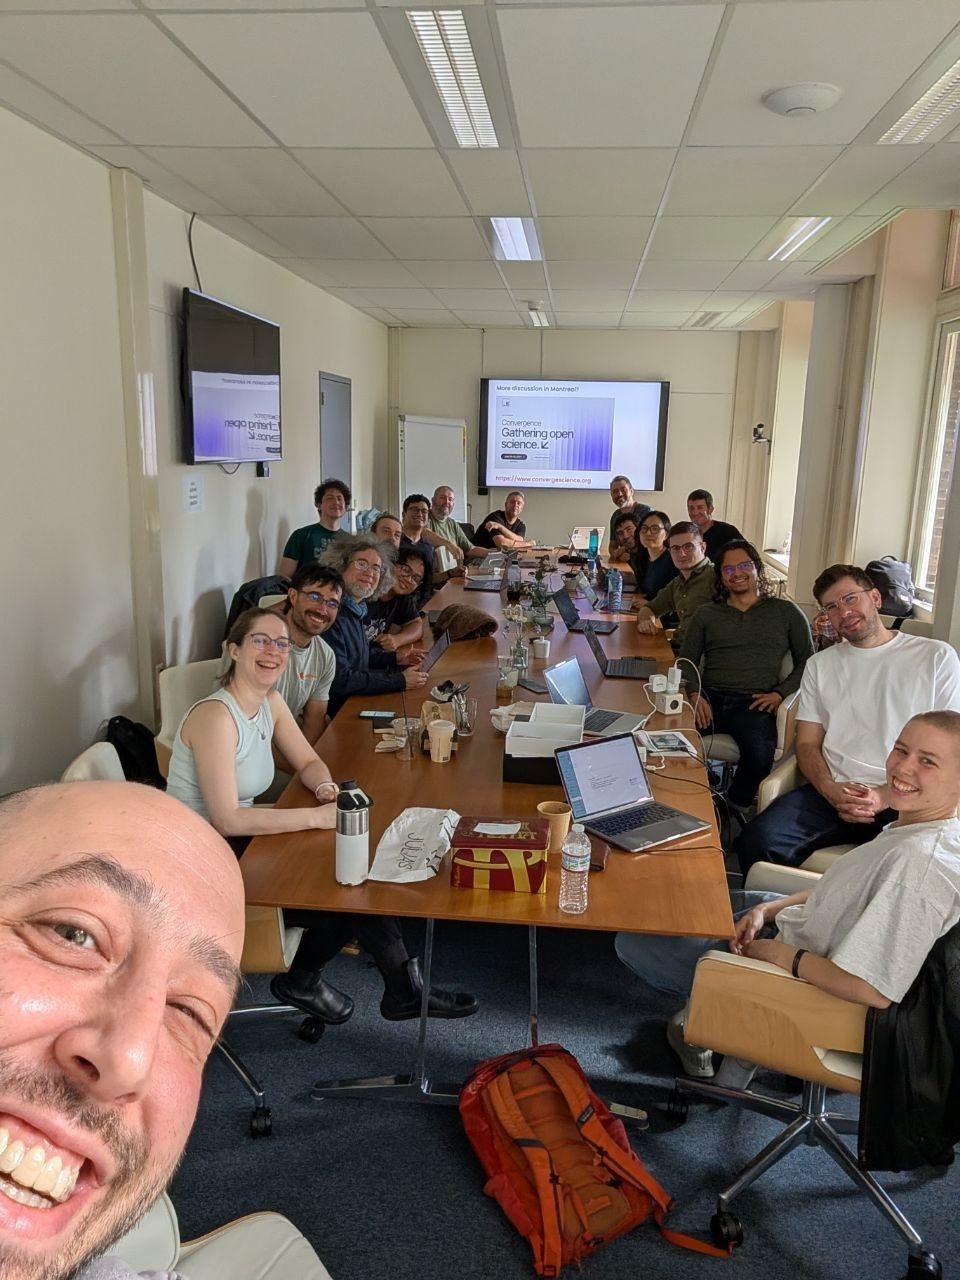
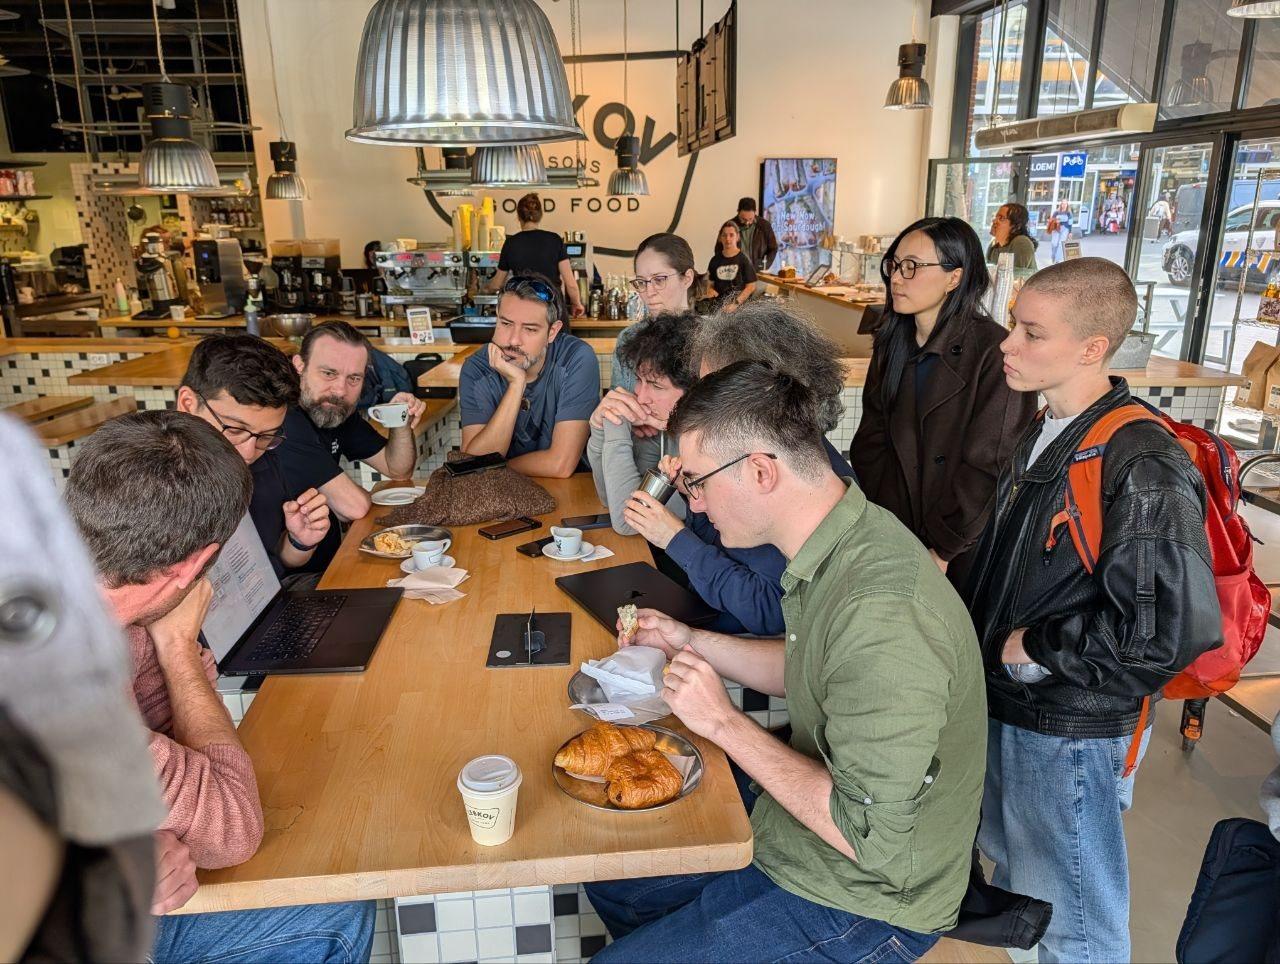
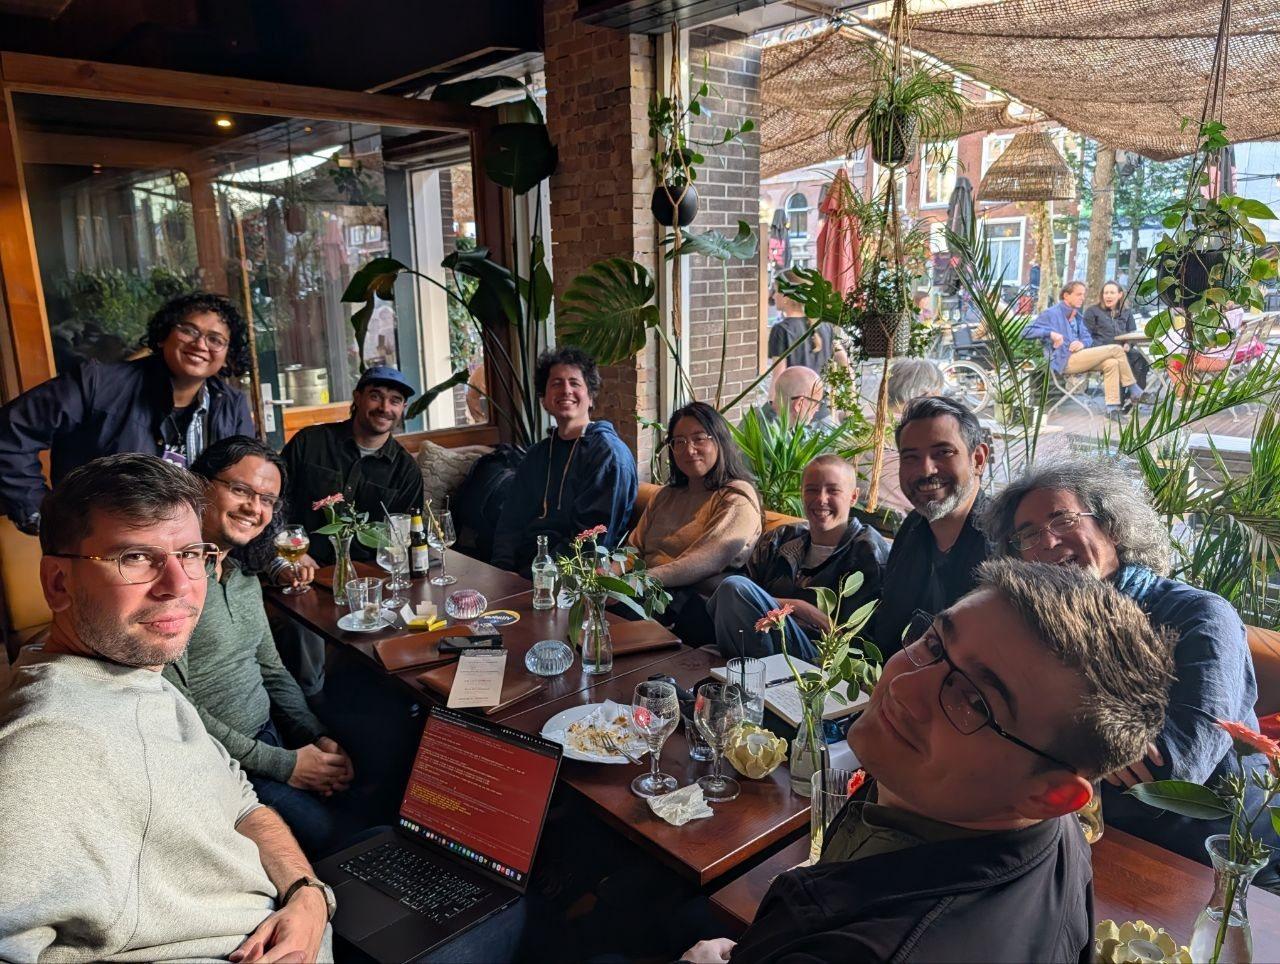
We recorded three of the sessions, which reached these results.
People from more than a half-dozen projects worked on how to describe modular science with one voice.
The hosts brought draft definitions, and the room reworked the drafts together.
The group sorted more than twenty projects, among them OXA, MIRA, Octopus, nanopublications, and Semble, into four areas:
How documents are represented
How knowledge is represented
How work is checked, evaluated, and curated
How people discuss and organise research
The schema's designers agreed that a piece of evidence must be open to challenge in two places, the data and the statement that describes the data.
MIRA and Bycelium found a way to work together through a small shared core, extensions for each tool, and a connector that translates between the two schemas.
The group first asked what journals still do now that researchers can share work online themselves, and most agreed that their main remaining job is to put work on the record with a stamp of quality.
Much of the hour went on who should judge what is credible and worth reading.
Day 4, Starting a community theory of change
More than 2,000 public texts describe what open science should be. The 153 that SciOS analysed, including UNESCO’s Recommendation on Open Science, the Budapest Open Access Initiative, the Berlin Declaration, DORA, and the FAIR Principles, largely agree.
Agreeing on where science should go does not show how to get there from today.
A theory of change sets out, step by step, how to move from one systemic state to another, listing all the assumptions in the process.
To describe today’s system, we played sad science bingo, where each person filled a card with bad practices from their own experience of science.
So many cards matched that players reached bingo before the second round of sharing was over, a sign of how common these problems are.
Small groups then described the research system they would want to work in and read out their lists.
Almost every list asked for careers that credit every kind of contribution, including software, data, and the work of linking results to the claims they affect; for funding that lets people live by being curious and does not have to be won again every year; and for science shaped with citizens and the communities closest to a problem.
Last, four groups each took one kind of infrastructure that shapes how science works (technological, economic, cultural, or institutional).
Each group wrote which bad practices its kind of infrastructure enables today, what blocks the better practices, and if-then statements for getting around the blocks.
The technological group’s if-then statement
Ifeach field can easily define its own schemas,
thenmore people will write their knowledge in a structured form, because the schemas fit how their field thinks.
The cultural group’s if-then statement
Ifwe change the way we define impact,
thenwe reach evaluation based on the quality of the work.
The technological group’s if-then statement
Ifeach field can easily define its own schemas,
thenmore people will write their knowledge in a structured form, because the schemas fit how their field thinks.
The cultural group’s if-then statement
Ifwe change the way we define impact,
thenwe reach evaluation based on the quality of the work.
The last morning was the first session of a theory of change for science, which the community will build over time.
In the coming weeks, we will share a synthesis of this first theory of change session as a starting point for the community to keep building on.
The event ended with a closing circle, in which 18 of us took turns to speak.
Scroll to read a line from each person, or press Play to hear the recording.
We meet again in April 2027 at ATScience x IOSP, where anyone who has built something since Leiden will show their work.